
Over the last 12 months, we (Contrast) have been commissioned by .store Domains to run an experiment to compare and see if there are any performance differences in using a .store vs a .com domain for your eCommerce website.

There isn’t any public data available on this, so we didn’t know how this would play out.
To test this, we launched two eCommerce websites selling the same products. We kept all the elements on the two websites identical, including the number of pages, page layouts, product descriptions, blog topics, and paid search campaigns.
The second-level domain was also the same. The only major difference was the domain extension, or the TLD (top-level domain). One website used the .com domain extension (brandname.com), while the other used the .store domain extension (brandname.store).
We wanted to run this as any business owner or creator would want to do for their own store from a resources and knowledge perspective. To that end, the stores were built using Shopify, and we didn’t invest an excessive amount of time into paid campaigns or SEO. We wanted to ensure that those investments mirror what an owner could achieve in their monthly workload.
The main thing here is that, unlike most other experiments like these, these would be actual online stores customers could buy from, not just fronts to collect data. This way, the experiment could be as real as possible.
The blog had identical topics but the content was reworded so that search engines and users interpret the websites as unique. We also wanted to avoid content duplication, as that could have negatively impacted the search engine rankings of the two websites.
In addition, we used slightly different primary colors, images, and fonts across both websites. This was to reduce the chance of a user confusing one of the experiment websites for another or assuming the websites were duplicates and, therefore, could be a scam.
We cannot discount that these differences may have impacted our results. However, we have taken measures to minimize these variables.
Another way we controlled the variables within this experiment was by using brand-new domains for both the websites, registered at the same time, with no pre-existing history. This ensured the websites were not biased in their performance due to previous domain history.
As part of this test, we decided to look at each website’s performance from an indexing, paid search, and SEO perspective.
You can view what each of the websites looked like below, as we have created replicates of them for you to view through real-life screenshots of each store.
How does .store perform in indexing?
If you want to receive any organic traffic (SEO) from search engines like Google, your website needs to be crawled and indexed by the search engines. Google will crawl webpages to look for keywords, content quality, and meta descriptions, add them to its index, and decide how it wants to rank them.
With this being a critical part of the experiment, we wanted to see how both stores (brandname.com & brandname.store) performed when crawled and indexed by Google.
Each website started with 34 pages, which were broken down into product, category, and information pages (i.e. About page). We would then track and record this data daily per URL per website.
As these were two brand-new websites, they had previously never been crawled or indexed. Therefore, for this part of the experiment, we decided to split this test into two parts.
For the first part, we decided to only submit the website’s sitemaps to Google Search Console (GSC) to see how much natural coverage each website would gain within 15 days.
For the second part, which involved all the webpages that were not indexed through step one, we then requested each specific URL to be indexed again through GSC. This time though, it was through their URL inspect tool.
Brandname.com’s indexing results
The results show that by day 6, 32/34 (94%) of brandname.com pages had been indexed without any further manual indexing requests.
Only one URL had to be requested to be crawled and indexed after the 15-day period; this one URL was then indexed the same day. Therefore, this site had full coverage of all 34 URLs in 15 days.
Brandname.store’s indexing results
The results show that by day 6, 19/34 (56%) of brandname.store pages had been crawled and indexed without any further manual indexing requests. One URL had been crawled, though not indexed.
At the 15-day mark, 9 URLs (26%) had to be requested to be indexed. Of these 9 requests, 6 were indexed on the same day the request was submitted. The remaining 3 URLs were indexed between 2 and 5 days after the submission of the indexing request. All 9 URLs only had to be manually requested once.
Brandname.store wins!
Brandname.com was 30% faster in getting the 34 pages fully crawled and indexed compared to brandname.store. This data suggests that Google seems to prioritize crawling and indexing a store on .com as compared to .Store.
That said, although brandname.com had faster indexing, it acquired fewer impressions over the first 30-day period than brandname.store. Brandname.com totaled 139 impressions, whereas brandname.store had 154 impressions.
So, despite the quicker indexing of the .com TLD store, the .store TLD website got more impressions over the first 30-day period. Ultimately, this is one of the leading metrics from indexing that we care about from an SEO perspective.
How does .store perform in paid search?
Do your potential website customers care if you are using a different domain extension to .com?
We wanted to test and measure the level of consumer trust based on actual consumer purchases and the conversion rates of each website.
After launching the stores, we then waited 3 months to introduce a paid search test as part of the experiment.
To keep this fair and minimize the variables, we kept the ad accounts the same across both websites. This means that the ad account structures, targeting, URL destinations, budgets, and bids were the same for both stores.
This ensured that no one account had been given preference, so how well the accounts ranked was fully down to their individual performance.
From this, we then looked at the individual websites’ conversion rates to evaluate if there was a preference for a specific TLD. This was done by looking at Google Ads data cross-referenced against conversion data in the Shopify stores.
We ran this PPC (Pay Per Click) test long enough to get sufficient data so we’d be able to see if, statistically, one website was, or was not, performing better than the other. In our case, we actually ran these ads for 5 months straight.
Brandname.com’s PPC performance
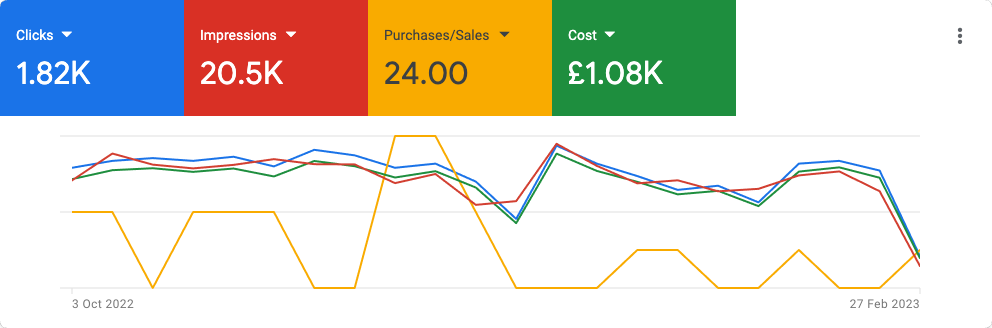
Over the 5-month period where the paid Google search ads were live, brandname.com accumulated 1,819 clicks, 20,488 impressions, and 24 sales.
Additionally, brandname.com had a conversion rate of 1.32% and an average CAC (customer acquisition cost) of £44.95.
Brandname.store’s PPC performance
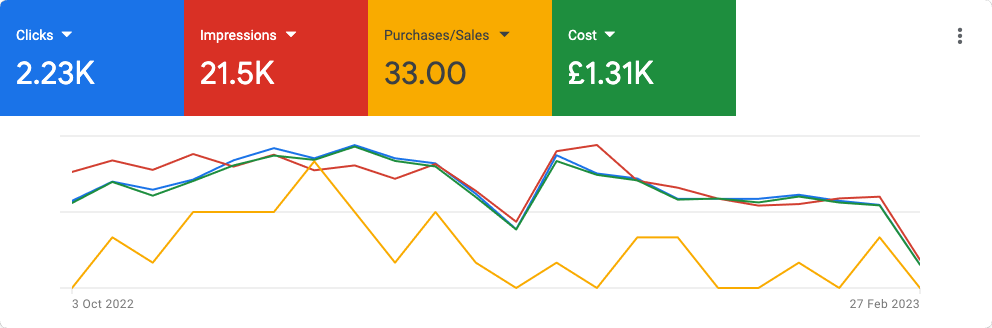
Over the 5-month period where the paid Google search ads were live, brandname.store accumulated 2,229 clicks, 21,547 impressions, and 33 sales.
Additionally, brandname.store had a conversion rate of 1.48% and an average CAC (customer acquisition cost) of £39.59.
PPC performance comparison
| Metric | Brandname.com | Brandname.store |
| Impressions | 20,488 | 21,547 |
| Clicks | 1,819 | 2,229 |
| Purchases | 24 | 33 |
| Cost | £1,078.73 | £1,306.54 |
| Click-through rate (CTR) | 8.88% | 10.34% |
| Avg. CPC | £0.59 | £0.59 |
| Conv. rate | 1.32% | 1.48% |
| Cost / Conv | £44.95 | £39.59 |
Brandname.store wins again!
First, we need to mention that although the paid search campaigns were identical, the PPC spend varied across the two paid accounts, causing an inability to actualize the data to campaign spend levels and creating uncertainty as to whether the results were affected.
This issue would have arisen whether an equal budget was maintained between the site campaigns or whether we’d paused both campaigns when one site ran through its budget.
From a variables perspective, the former is preferable, and that’s what we did. It just so happened that brandname.store spent through its daily budget more efficiently, resulting in a higher PPC campaign spend but a cheaper average CAC (customer acquisition cost).
However, this does not directly correlate to the number of conversions relative to spend. Ultimately, experiments are not perfect but we controlled the variables as best as we could.
The hypothesis we had was, would there be a difference in trust from a consumer in wanting to buy from a .com domain vs a .store domain? Brandname.store had a 12.12% increase in conversion rate over brandname.com (1.48% vs 1.32%).
The conversion rates might look similar but if you forecast this out to running an eCommerce store doing $100,000s, if not $1,000,000s, worth of business, this small difference of 0.16% could be worth $10,000s.
Additionally, the CAC (customer acquisition cost) was cheaper for brandname.store at £39.59 vs. £44.45 for the site brandname.com.
CAC and conversion rates tend to be among the most important KPIs (key performance indicators) for eCommerce businesses, and as you can see, brandname.store outperformed brandname.com on all fronts through this paid test.
How does .store perform in organic SEO?
After the initial indexing phase, we left both websites alone for 3 months to see how things naturally played out from an SEO perspective.
After this, we started to write and post blog content. In total, we published 34 blog posts to both sites, just reworded. The blog content was a mix of reviews, comparisons, ‘best of’ posts, and industry guides. Each post targeted one of the 3 stages of a customer’s journey: awareness, consideration, and decision. The overarching aim was to encourage potential customers to place an order by way of relevant and informative content.
To help build up the authority of the websites, we built a total of 15 backlinks which pointed back to 15 individual articles. When identifying the guest posting opportunity for the experiment websites, we made sure to use industry-relevant websites. Each of the external websites linked back to both experimental websites, therefore the guest post content was slightly different to avoid a duplicated content issue.
The blog content and the links did not go live all at once. We drip-fed them over the course of the next several months. We did this to make sure that the posting schedule of the content replicated what a website owner working on their own would be able to do within their time and budget constraints.
Brandname.com’s SEO performance
It took 10 months and 20 days (324 days) for brandname.com to earn its first 100 clicks. Shortly after, at 11 months and 25 days (359 days), brandname.com received a total of 20,000 impressions, with these increasing as the experiment continued. It wasn’t until the last 30-day period of the experiment that brandname.com achieved its first 250 organic clicks.
Over the 12 months of the project, brandname.com gained a total of 24,822 impressions and 333 clicks.
Brandname.store’s SEO performance
It took 8 months and 19 days (264 days) for brandname.store to earn its first 100 clicks. Additionally, the site gained 20,000 impressions by 9 months and 23 days (296 days). It wasn’t until the last 30-day period of the experiment that brandname.store achieved its first 250 organic clicks.
Since the start of the project, brandname.store gained a total of 49,939 impressions and 623 clicks.
Organic SEO performance comparison
| Metric | Brandname.com | Brandname.store |
| Impressions (GSC) | 24,822 | 49,939 |
| Clicks (GSC) | 333 | 623 |
| Average click-through rate (CTR) (GSC) | 1.3% | 1.2% |
| Average position (GSC) | 33 | 31.6 |
| All page views (ex direct) (GA4) | 5,546 | 6,728 |
| Only organic page views (GA4) | 461 | 759 |
All website page views (excluding direct) are broken down into the following: products (28.05%), categories (26.07%), blog posts (9.08%), homepage (33.26%), information pages i.e. About page (1.65%), and miscellaneous i.e. policies, cart, account, search, checkout, and orders (1.64%).
Presented below is the keyword data from Google Search Console. It shows the total keyword footprint as well as the section performance of the blog vs non-blog content which we categorized.
| Site | Non-Blog Keywords | Blog Keywords | Total Keywords |
| Brandname.com | 318 | 467 | 712 |
| Brandname.store | 383 | 780 | 1,061 |
Brandname.store is once again the winner!
The data from the 12-month project is large enough to conduct significance tests which show that brandname.store consistently outperforms brandname.com in terms of organic SEO. This is shown through constantly higher clicks, impressions, and click-through rate.
- Brandname.store domain gained the first 100 clicks 80 days before brandname.com.
- Brandname.store acquired the first 20,000 impressions 63 days before brandname.com.
- Brandname.store had the larger keyword footprint, 49.01% larger than brandname.com.
- Brandname.store domain gained 250 organic clicks in any 30-day period 4 days before brandname.com.
- Brandname.store gained the first 100 clicks, received 20,000 impressions, and achieved 250 clicks in a 30-day window faster than brandname.com.
These results suggest that Google preferred the brandname.store domain over the brandname.com domain.
How does .store perform in statistical significance testing?
This is the nerdy section for those who want to understand the testing behind this experiment. The significance testing was conducted with code generated in the software MATLAB.
Significance testing involves using measures such as the mean and standard deviation (spread of the data) to identify small differences across a large set of data. The significant differences between the websites and their corresponding metrics are indicated in green.
Significance testing goes beyond comparing the means. It assesses if the differences across the metrics were brought about by chance, or instead, by a manipulation of variables. The green indicates there was enough evidence across the time period of the experiment to indicate a significant difference between the two websites. Therefore, it is implied that the manipulation of variables (differing TLDs) contributed to the significant difference.
On the other hand, the red indicates there was not sufficient evidence across the time period to indicate a significant difference between the metrics.
Significance testing paid search results
Mean value
| Clicks per day | Impr. | CTR per day | Avg. CPC | Cost | Conversions per day | |
| Brandname.com | 12.2081 | 137.5034 | 9.30% | 0.5942 | 7.2398 | 0.1611 |
| Brandname.store | 14.9597 | 144.6107 | 10.73% | 0.5874 | 8.7687 | 0.2215 |
Significance testing: Brandname.com vs Brandname.store
| Clicks | Impr. | CTR | Avg. CPC | Cost | Conversions per day | |
| p value | 1.53E-07 | 0.1067 | 3.93E-04 | 2.11E-04 | 3.90E-07 | 0.142 |
Significance testing organic search results
Mean Values
| Clicks per day | Impressions per day | Average CTR per day | |
| Brandname.com | 0.9098 | 67.8197 | 0.56% |
| Brandname.store | 1.7022 | 136.4454 | 0.71% |
Significance testing: Branded.com vs Branded.store
| Clicks | Impressions | CTR | |
| p value | 1.96E-09 | 0.0067 | 1.74E-05 |
Key
| What does E stand for? E-06 = 0.000006 (6 zeros) | |
| p < 0.05 | Significant difference between the two sites using the corresponding metric |
| p > 0.05 | NO significant difference between the two sites using the corresponding metric |
Brandname.store wins yet again!
We cannot use measures of statistical significance to compare totals or means. Significance testing requires a moderate amount of daily data to find significant differences in trends across a spread of data. This means we cannot use significance testing to measure the difference between the total number of conversions, cost per conversion, or conversion rate because these are singular figures. This is also due to the fact that the daily data isn’t sizable and consistent enough to make these statistical conclusions.
We could not measure the statistical significance of 2 KPIs: cost per acquisition, and conversion. We were, however, able to do so for all of the other KPIs. Based on our findings, brandname.store outperformed brandname.com in terms of clicks, CTR (click-through rate), average cost per click, and cost.
The data from the organic SEO aspect of this project is large enough to conduct significance tests which show the brandname.store domain consistently organically outperforms the brandname.com domain. This is shown through constantly higher clicks, impressions, and click-through rate, making the brandname.store data statistically significant.
Experiment Summary
Considering the perception that .com is the more well-recognized domain extension, the results came as a surprise. We expected them to be equal if not weighted towards the .com domain. On the contrary, the .store website statistically outperformed the .com website in nearly all KPIs.
During the initial indexing stage, brandname.com outperformed brandname.store. However, when following this from an overall paid search and SEO perspective, brandname.store statistically outperformed brandname.com on all but one measurable KPI.
In Google’s own guidelines documentation, they say, “Overall, our systems treat new gTLDs like other gTLDs (like .com and .org)”. We can safely say that this is true. The new gTLDs (like .store) are not looked at or weighted against in a negative way that would affect a website’s performance; in our case, it was only positive.
These results encourage us to consider a .store domain extension for an online store. Additionally, from securing and locking down IP (Internet Protocol) when registering domain names as a brand, a store owner should consider purchasing a .store domain so that no one else has the opportunity to buy it and launch a store to compete against their current website.
Finally, if one wants to launch a store and keep it separate from their main website, a .store domain could be a solid platform to build a store with its own unique identity while still remaining closely connected to the main .com website.
This article was originally published on Contrast’s website.